Getting Started
Adding monitor
Creating and Managing Uptime Monitors with Your Service
Welcome to the tutorial on how to set up and manage uptime monitors using your uptime service! Uptime monitors are crucial for ensuring the availability and reliability of your websites or applications. In this guide, we will walk you through the process of creating monitors, specifying their parameters, and configuring notifiers for timely alerts. Let's get started!
Step 1: Accessing the Uptime Service Dashboard
- Login: Open your web browser and navigate to your uptime service's login page. Enter your email to get magic link to access the dashboard.
Step 2: Creating a New Uptime Monitor

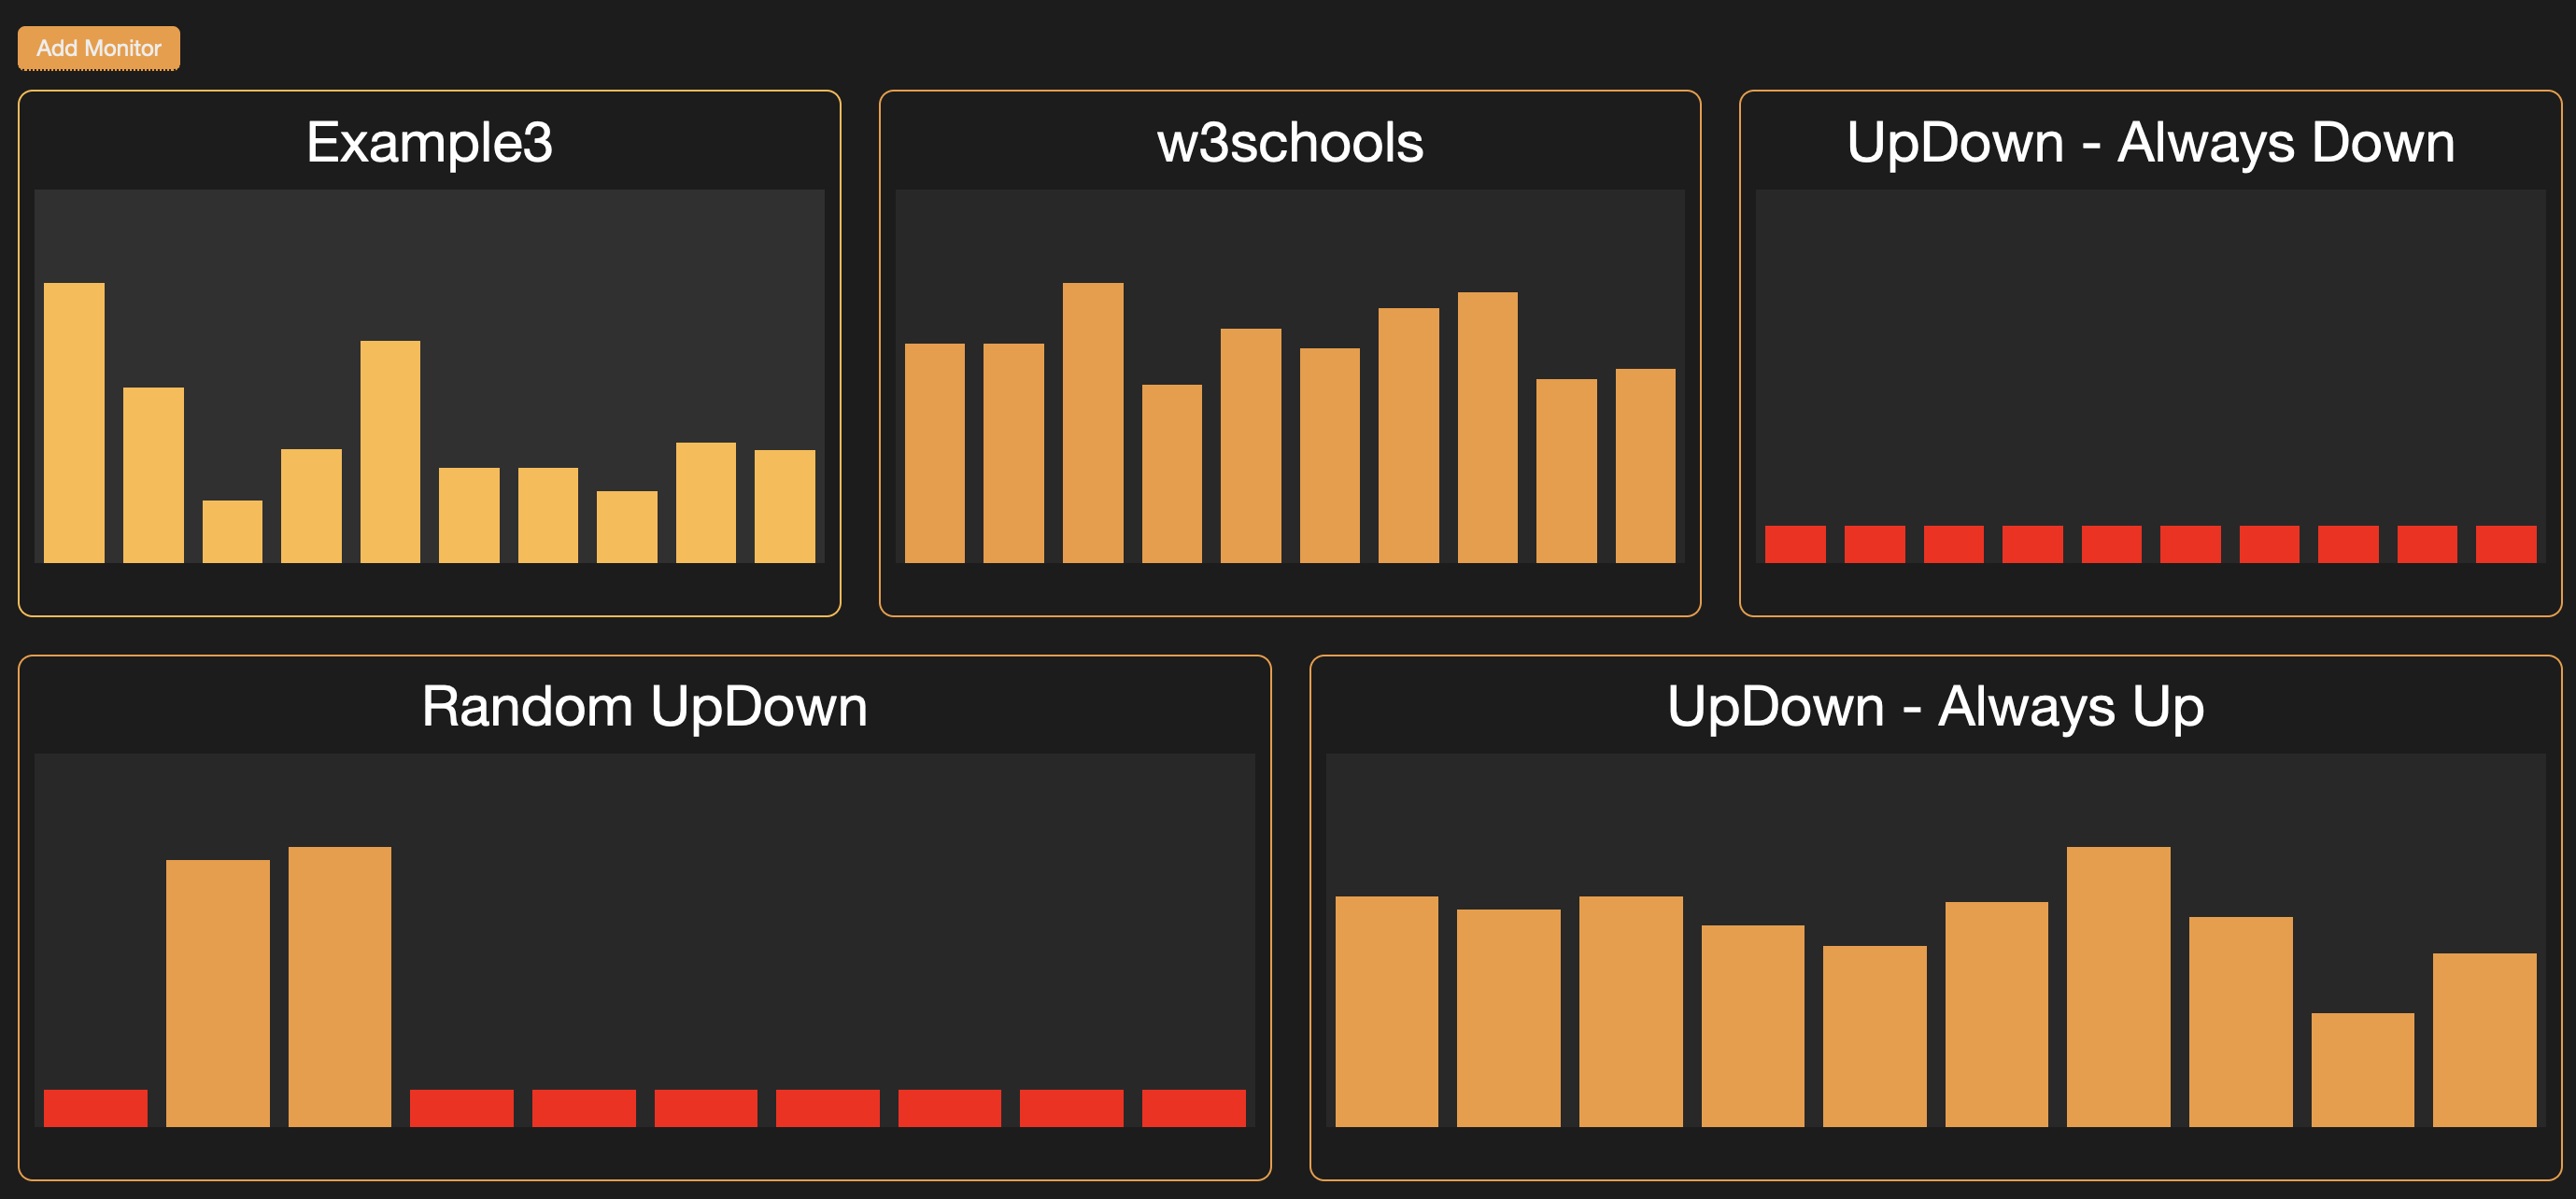
Navigate to Monitors: Once logged in, you will be directed to the dashboard. Look for a button labeled "Add New Monitor" and click on it.
Step 3: Configuring Monitor Settings
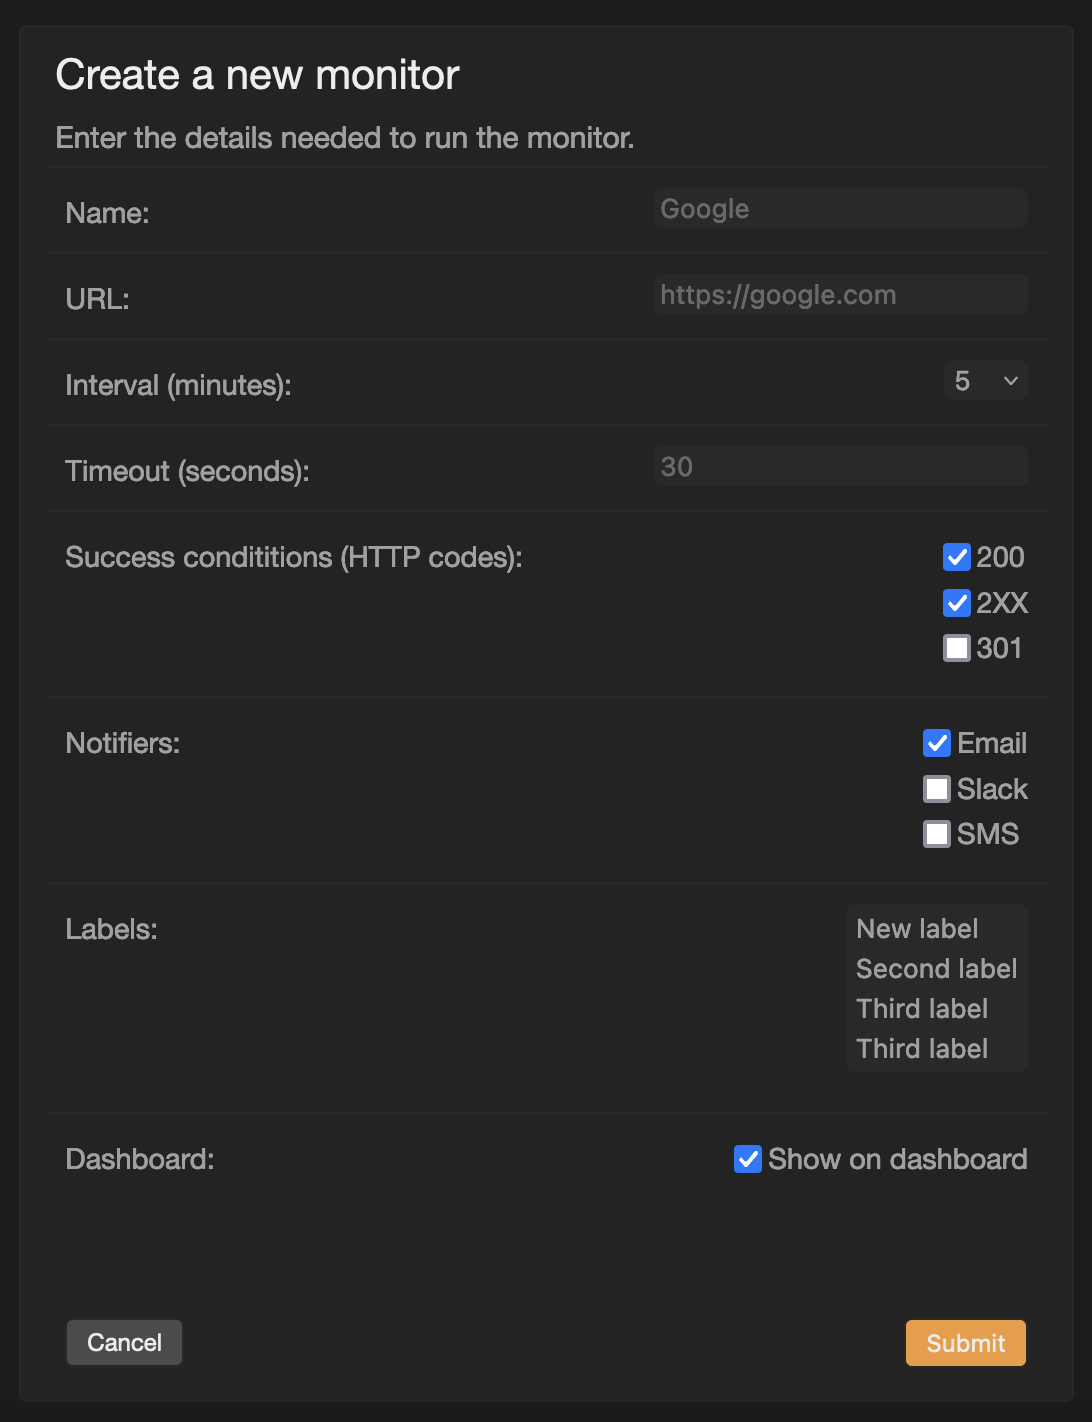
Basic Information:
- Name: Give your monitor a meaningful name, such as "Main Website" or "API Endpoint."
- URL: Enter the URL of the website or API endpoint you want to monitor.
Monitoring Parameters:
- Interval: Set the time interval between each check. This determines how often your service will check the specified URL for its availability.
- Timeout: Define the maximum time your monitor will wait for a response from the URL before considering it as unavailable.
Success HTTP Status Codes:
- Specify the HTTP status codes that indicate a successful response from the server. Common success codes include 200 (OK) and 201 (Created).
Notifiers:
- Choose the notification methods you want to use for alerts. Currently there are three options: SMS, email, and Slack. Select the ones you want to use.
- SMS: Include phone number in your settings page.
- Email: This will be your login email address.
- Slack: Provide your Slack API keys and your Slack channel in the settings page.
- Choose the notification methods you want to use for alerts. Currently there are three options: SMS, email, and Slack. Select the ones you want to use.
Step 4: Save and Activate the Monitor
Save Settings: Double-check all your monitor's settings to ensure accuracy. If everything looks good, proceed to save the settings.
Activation: After saving, your monitor will be immediately activated. You can pause it on the monitor page. You can find your monitor on the dashboard or on the l"List Monitors" page
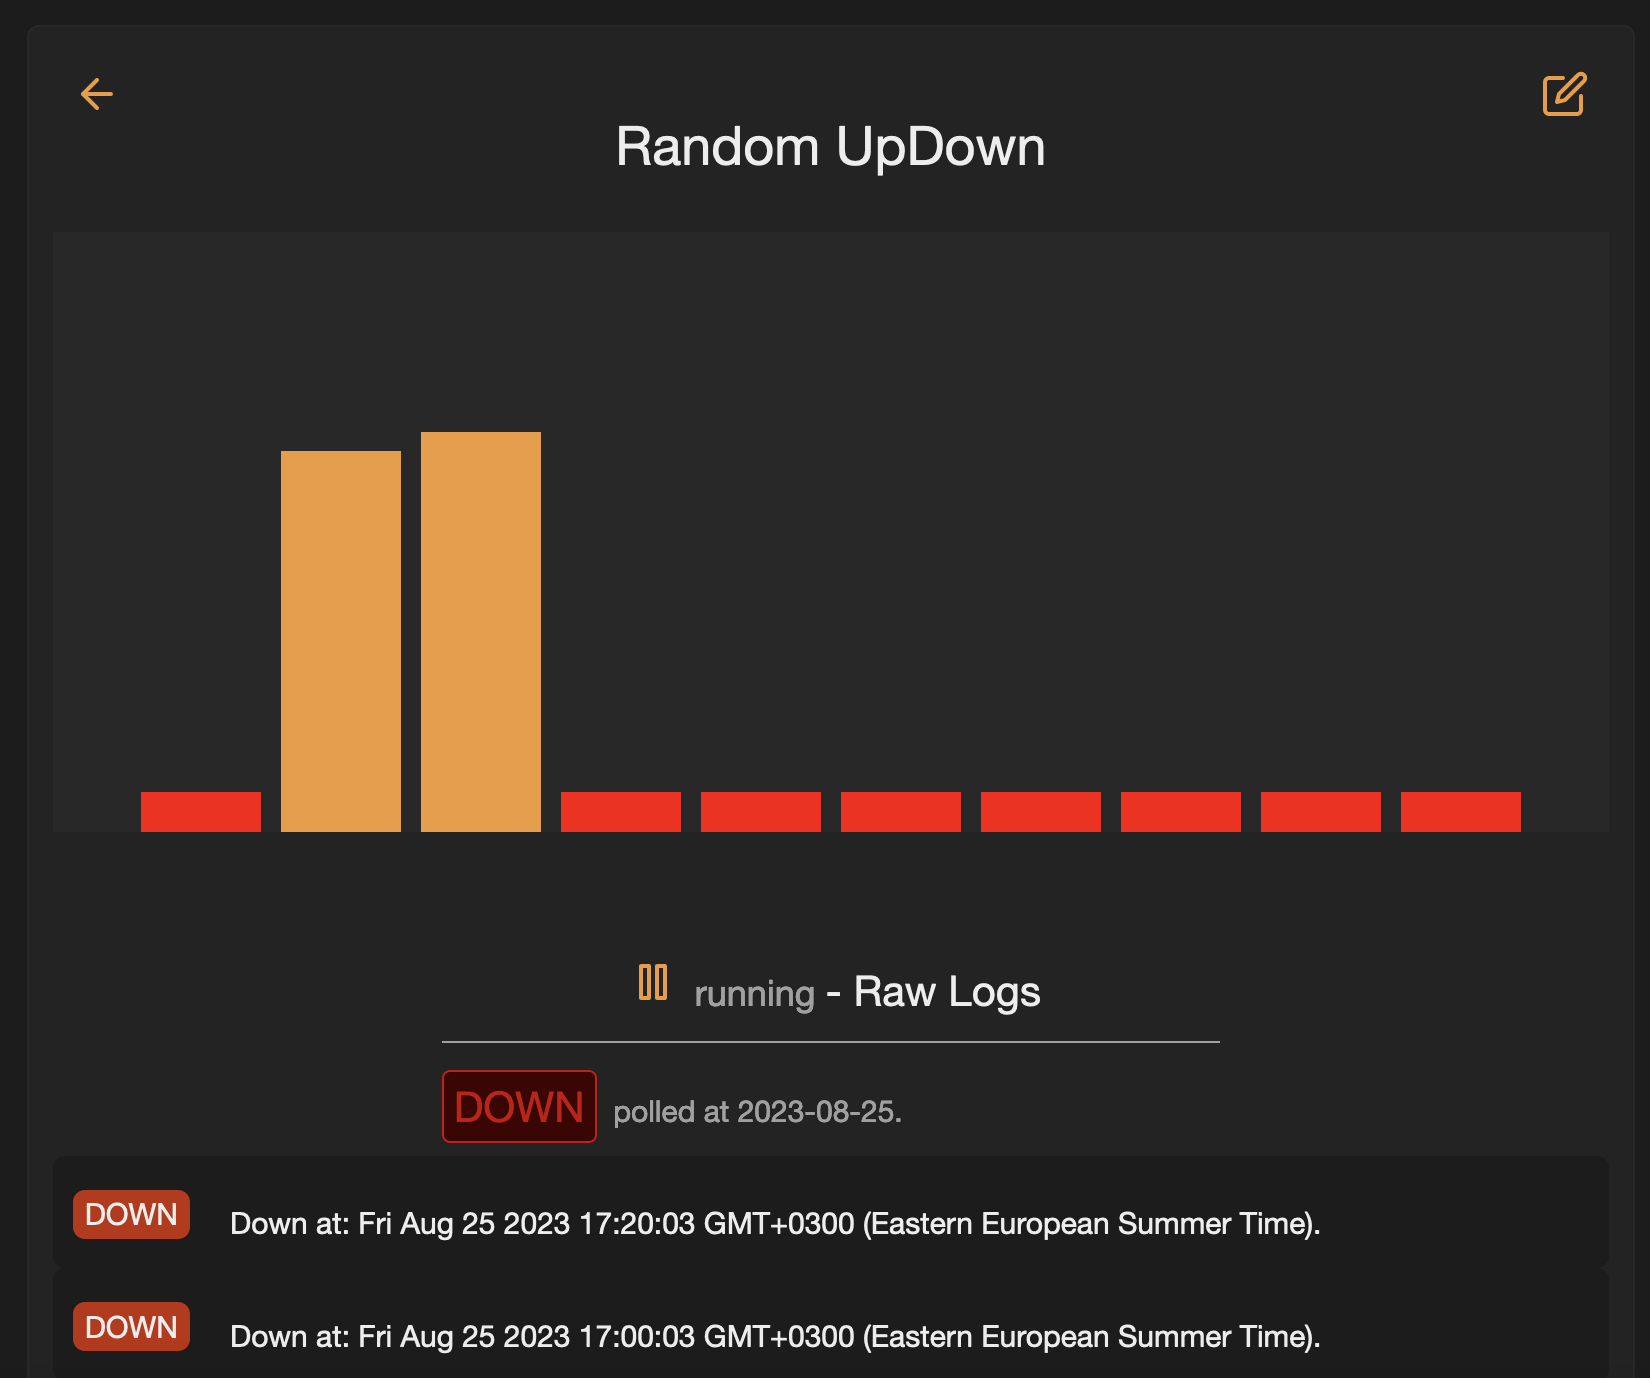
Step 5: Monitor and Notifications
Monitoring: Your uptime service will now begin checking the URL at the specified intervals. It will evaluate the response against the success HTTP status codes.
Alerts and Notifications: If the monitor detects an issue (e.g., the response status code is not among the success codes), it will trigger the configured notifiers.
- If you configured SMS, you'll receive a text message.
- If you configured email, you'll get an email alert.
- If you configured Slack, a message will be sent to the specified Slack channel.
Step 6: Managing Monitors
View Monitors: You can always access your list of monitors from the dashboard. This is where you can see the status and details of each monitor.
Edit and Delete: If you need to make changes to a monitor's settings or if a monitor is no longer needed, you can edit or delete it accordingly.
Congratulations! You've successfully set up and configured an uptime monitor using your service. By following this tutorial, you can ensure the continuous availability of your websites and applications and receive timely notifications whenever an issue arises. Remember to regularly review and update your monitors as your service evolves. Happy monitoring!